Shay Ohayon at Caltech just conducted an experiment that makes use of the numerous new modules that he developed for the Open Ephys system over just the last two months. He recorded neurons from the Middle Face Patch and verified the recording by analyzing the data in real time. Here's what he had to say:
When I first heard about Open Ephys, I got very excited. The system is extremely cheap and everything is open source. However, after I got my hands on the hardware and software, I was initially disappointed. The initial software release lacked many basic features one would need to run a full-blown acute monkey electrophysiology experiment. There wasn't an option to do real-time spike sorting, or to display real-time firing rates. Furthermore, it lacked the ability to connect to external sources of information, like events arriving from a machine which presents stimuli. Nevertheless, I saw a great potential in the design and decided it would be worthwhile to program all the missing components.
Two months have passed since. With a lot of help from Josh Siegle and the rest of the Open Ephys community, we are now close to releasing a new stable version with many new features that make the system much more useful for acute experiments. In many ways, it has surpassed the capabilities of my old recording system (MAP by Plexon).
Last week I finally found the time to test Open Ephys on my monkey. Below are some notes on my configuration and the new features that I have added:
Summary of the experiment and configuration
My first goal was to try and recreate the standard way signals are processed in Plexon. Josh was extremely helpful in debugging bugs related to split & merge modules, and recently Josh added this great feature that permits the visualization of the entire signal chain:
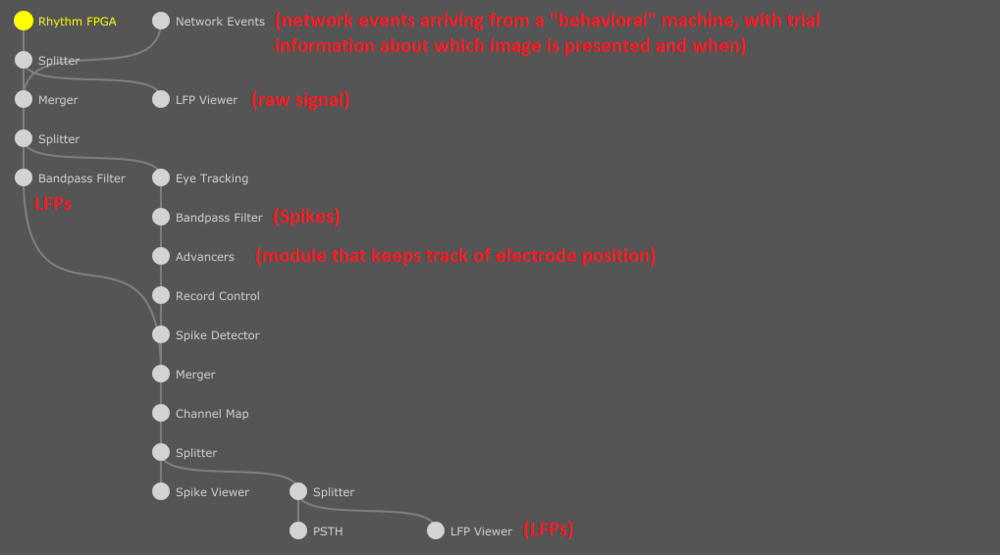
As you can see, the initial signal is split into two, a high pass version that goes into a spike detector, and a low pass version that computes LFPs. Furthermore, there is another input, called "Network Events", that can receive strings over TCP/IP with various information coming from other machines. An Eye Tracking module is capable of communicating with standard ISCAN system and adds eye position information to the signal chain.
The advancers module is used to keep a record on where each electrode was placed in the recording chamber, and also records information about the depth of each probe that changes during the experiment. This makes post-processing analysis much easier!

The new spike detector module gives the user the ability to isolate units in real time, either by the box method, or polygons in true PCA space:

There is no limit on the number of units that the user can add. In this example, I have a yellow unit defined with two boxes (spike wave form must intersect both boxes), one green unit that is defined in PCA space, and a cyan unit that is defined with a single box.
Finally, the PSTH module can display firing rates, averaged relative to trial onset, and aggregated across similar trial types (junk data, just for demonstration purposes):

Here, each curves corresponds to a different category (think trial types that all have something in common).
Both trial and category information is sent over TCP/IP. High accuracy trial alignment can also be achieved by sending a single TTL pulse. However, software timestamps are quite accurate as well (~3-4 ms jitter, when sent from a different machine). Software timestamp taken in the machine running HUI scan be easily converted into hardware timestamps with very good accuracy using robust linear regression:

For my actual experiment, I recorded with a single electrode (1 MOhm), targeting the so called "Middle Face Patch" (image generated with Planner)

At depth 52mm, I was able to isolate a noisy unit (data shown below is from the real time spike sorting):

Trials were sent from our behavioral machine, which displays images to the monkey. The behavioral machine sent information about which image was displayed. This information was acquired in GUI using the Network Events source (see Spike sorting & PSTH). I could determine in real time that unit 2 was face selective by looking at the PSTH curves (unfortunately, I didn't take a snapshot). In post-processing, it is quite easy to read out the trial information that was sent and build an average raster plot (smoothed with a 3 ms gaussian kernel):

Here, you can see the average responses relative to image onset (approximated onset, photodiode information still not taken into account). First 16 images are face images, and the rest are non-face images.
The PSTH, averaged across the six image categories is:

which looks very very similar to what the PSTH module showed in real time.
Conclusion
The new spike sorting branch seems to be ready for action! It can be used in acute experiments in which real time characterization of isolated units is required.
Minor issues still remain, but all will be addressed in the upcoming weeks.
To view the code Shay used for these experiments, check out the "spikesorting" branch of the GUI on GitHub.